Mathematical Probability Modeling in 75-Ball Versus 90-Ball Bingo Grids
Bingo Card Online Editorial • Reviewed by Joan Ramos • Updated October 2026 • Mathematical Research Authority Series

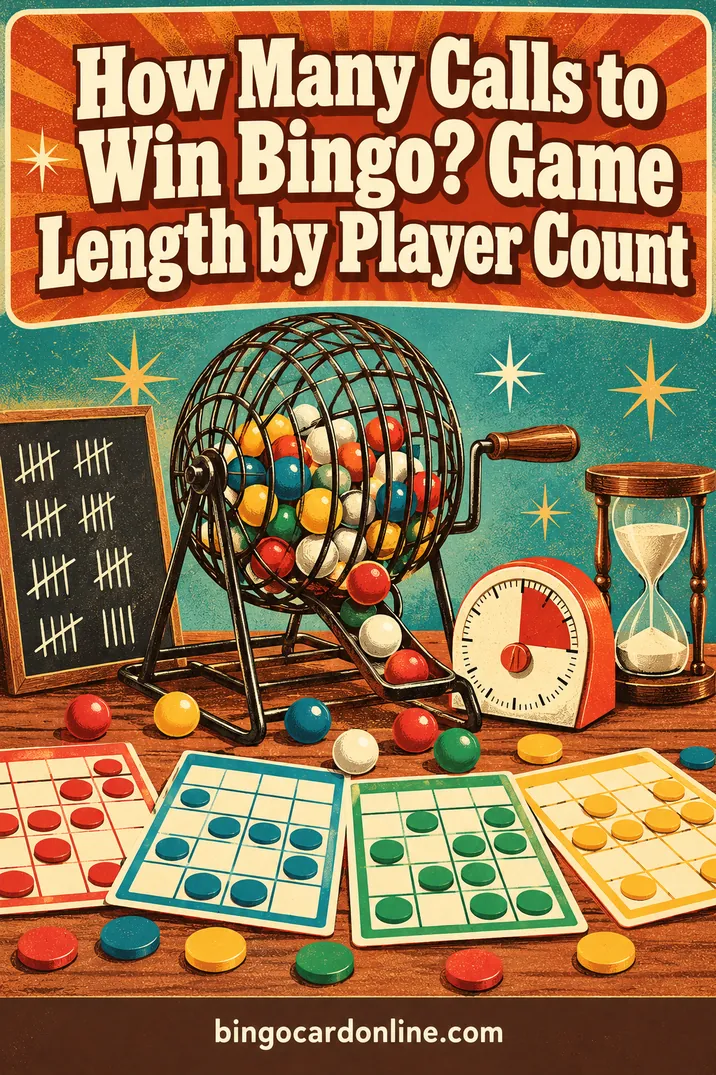
High-resolution photographic capture representing discrete combinatorial probability distributions in mechanical mixing chambers.
The mathematical analysis of grid lotteries presents an intersection of combinatorial design theory, discrete probability distributions, and stochastic process modeling. While casual participants view bingo as a recreational activity dictated by chance, mathematicians recognize that operational mechanics diverge based on grid geometry and numerical ball density. The two primary worldwide paradigms, the North American 75-ball five-by-five matrix and the British and Commonwealth 90-ball nine-by-three strip layout, operate on distinct probabilistic foundations. Investigating these systems mathematically reveals contrasting behavior across path permutations, discrete sampling spaces, and absorbing state progression rates across gaming environments.
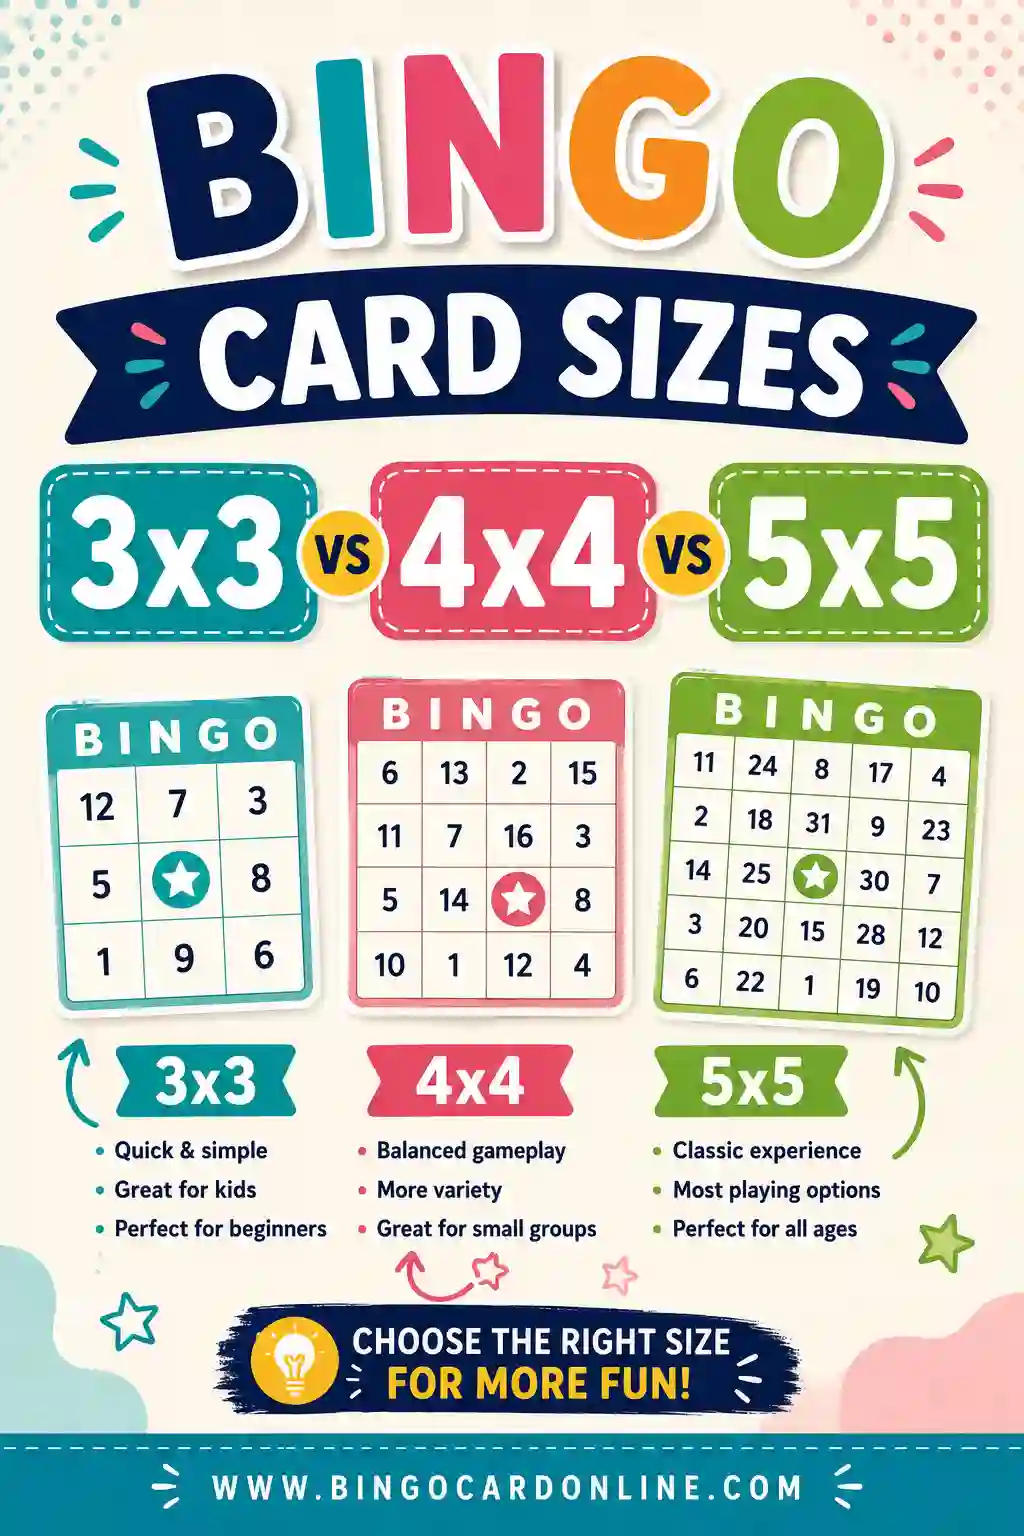
At the center of this inquiry lies discrete random selection without replacement from a finite reservoir. The geometric arrangement of targeted values across the playing surface dictates how rapidly winning states materialize. A 5x5 card features twenty-four numbered cells and a central free space bound by column constraints. Conversely, a 90-ball ticket features twenty-seven cells across three tiers with fifteen active numbers across nine decade columns, producing contrasting hypergeometric probability curves and state transition matrices across tournament sessions.
Understanding these mathematical distinctions carries practical implications for tournament organizers, software engineers constructing digital gaming engines, and educators deploying probability simulations. When calculating the probability of completing a row, diagonal, or blackout coverall, analysts must account for mathematical dependency between successive calls. Every drawn ball alters conditional distributions for subsequent turns. This comparative study deconstructs the mathematical architectures of both paradigms through combinatorial proofs, probability density formulations, collision modeling, and computational frameworks.
Combinatorial Foundations of 75-Ball Five-by-Five Matrix Permutations
The standard North American bingo architecture is formulated upon a five-by-five square coordinate matrix governed by structured column segregation. The global pool of seventy-five integers, ranging from 1 to 75 inclusive, is partitioned into five contiguous blocks of fifteen elements: B (1-15), I (16-30), N (31-45), G (46-60), and O (61-75). This column-restricted allocation mathematically restrains potential card permutations to ensure uniform numerical density across the layout.
To compute uniquely constructible cards under column rules, we apply elementary combinatorial permutations. For columns B, I, G, and O, five distinct numbers are selected from fifteen without replacement: P(15, 5) = 15! / (15 - 5)! = 360,360. The central column (N) features a fixed non-numeric free space located at coordinate (3, 3), requiring only four integers: P(15, 4) = 15! / (15 - 4)! = 32,760.
Because column selections are statistically independent, total theoretical permutation space equals the product of column permutations: P(total) = (360,360)^4 * 32,760 ≈ 5.524 x 10^26 uniquely ordered physical playing surfaces. When disregarding vertical order within columns, the combination space equals C(15, 5)^4 * C(15, 4) ≈ 1.110 x 10^17 unique numerical sets.
This immense combinatorial volume guarantees that in physical or digital gaming environments, the probability of two independently generated cards possessing identical numerical combinations is negligible under uniform random sampling. Mathematical researchers examining combinatorial structures, such as those cataloged in the Stanford Probability Archive, routinely utilize this column-stratified model to demonstrate how structural constraints maintain astronomical state spaces. By partitioning numbers into bounded subsets, generators eliminate clumping anomalies while preserving maximal entropy across consecutive game rounds.
Discrete Probability Architecture in 90-Ball Nine-by-Three Strip Formats
The 90-ball format utilized across the United Kingdom, Europe, and Australia relies on a 9x3 rectangular grid ticket from a pool of integers 1 to 90. A single ticket contains twenty-seven cells: fifteen active numbers and twelve blank spaces. Each of the three horizontal rows contains exactly five numbers and four blanks, establishing a balanced row density of 55.56 percent coverage.
Vertical columns follow decade grouping: column one covers 1-9, columns two through eight cover ten numbers each, and column nine covers 80-90 (eleven numbers). Each column holds between one and three numbers in ascending vertical order. Tickets are manufactured in unified six-ticket strips containing all ninety numbers across six tickets without omissions or duplicates.
- Row Structural Regularity: Exactly five active numbers and four blank coordinates per horizontal row, establishing three non-overlapping winning lines per individual ticket.
- Decade Column Allocation: Column widths span defined intervals (1-9, 10-19, through 80-90), with column populations ranging from nine to eleven total numbers.
- Six-Ticket Exhaustive Strip Integration: A complete strip contains 6 tickets times 15 numbers, equaling ninety unique numbers, guaranteeing 100 percent global coverage without numerical redundancy.
Computing the total number of valid individual 90-ball tickets involves combinatorial integer partitioning across bipartite grids. Advanced discrete mathematics literature, including foundational studies curated by the MIT Discrete Mathematics Courseware, treats this grid architecture as an exact integer allocation problem on bipartite graphs where row and column marginal sums remain strictly invariant. Analysts first determine the distribution of active numbers across nine columns summing to fifteen, then arrange them across three horizontal tiers with five elements each to preserve balance.
Hypergeometric Distribution Modeling for Line Completion
Evaluating marking progress in 75-ball and 90-ball formats requires sampling without replacement from a finite population. Probabilities cannot be modeled via binomial distributions, which assume constant trial probabilities. Instead, exact formulations require hypergeometric distributions. Let N represent total ball population (N = 75 or N = 90), K represent targeted winning pattern squares, and n represent drawn balls.
The random variable X represents marked squares on a target pattern after n draws. The probability mass function (PMF) for matching k target squares is P(X = k) = [C(K, k) * C(N - K, n - k)] / C(N, n), where C(a, b) = a! / (b!(a - b)!). The support is max(0, n - (N - K)) <= k <= min(K, n). The cumulative probability that pattern K is completely filled by draw n simplifies to P(X = K) = C(N - K, n - K) / C(N, n) for n >= K.
For a horizontal row on a 75-ball card not intersecting the free space (K = 5, N = 75), completing the row on exactly draw n requires matching four numbers in the first n - 1 calls and the fifth on call n: P(Complete on draw n) = [C(5, 4) * C(70, n - 5) / C(75, n - 1)] * [1 / (75 - (n - 1))]. Summing these marginal probabilities from n = 5 to m yields the cumulative distribution function (CDF) for row completion.
For a horizontal line on a 90-ball ticket (K = 5, N = 90), the larger pool reduces completion probability per draw. At n = 20 calls, the probability of completing a non-free-space five-number line on a 75-ball card is C(70, 15) / C(75, 20) ≈ 0.000784 (1 in 1,275), whereas on a 90-ball card it is C(85, 15) / C(90, 20) ≈ 0.000201 (1 in 4,975), illustrating distinct pacing profiles between formats.
Central Free Space Dynamics and Path Velocity Acceleration
One of the structural distinctions between North American 75-ball bingo and 90-ball bingo is the inclusion of the central free space at coordinate (3, 3) on the 5x5 grid. From a mathematical modeling perspective, the free space functions as a predetermined match requiring zero call verification. It is an active token present on the board prior to call n = 1. Consequently, the presence of the free space creates asymmetry across the twelve standard single-line winning paths available on a 75-ball card.
Four of twelve winning lines intersect the central coordinate: row three, column three, and both diagonals. For these four paths, target size is reduced from K = 5 to K = 4 numbers out of seventy-five, while the other eight lines require K = 5. Cumulative probability for completing a four-number line by draw n is P(X = 4) = C(71, n - 4) / C(75, n), exceeding a five-number line by approximately (75 - n + 1) / 5 in early cycles.
At n = 15 draws, four-number path completion probability is approximately 0.00115 versus 0.00016 for five-number paths (over seven times higher). At n = 30 calls, four-number probability reaches 0.0216 versus 0.0068 for five-number lines. This explains why 75-ball single-line outcomes exhibit statistical bias toward diagonal and center-row victories. Conversely, 90-ball tickets possess zero free spaces; every row requires five matched numbers, maintaining a homogeneous probability landscape across all active linear vectors.
Markov Chain Transitions and State Space Trajectories
To capture dynamic progression of an entire card rather than isolated lines, mathematical analysts model bingo gameplay as an absorbing Markov chain. Let the state of a playing card at any point in time be defined by a multi-dimensional state vector S = (c1, c2, ..., cp), where each component ci represents current count of marked numbers on the i-th potential winning path. For a 75-ball card with twelve linear paths, S is a 12-dimensional vector. For a 90-ball card evaluated for single-line victory, S is a 3-dimensional vector tracking marks across rows one, two, and three.
Because balls are drawn sequentially without replacement, state transition probability from time step n to step n + 1 depends strictly on current state vector S(n) and remaining composition of the ball population. The system satisfies the Markov property: future state depends only upon current state. An absorbing state is reached whenever any component ci of the state vector attains its requisite target threshold (ci = 5 for standard lines, or ci = 4 for free-space lines in 75-ball play). Once an absorbing state is achieved, the game terminates for that individual card.
- Multi-Vector Coordinate Intersection: Numbers positioned at coordinate vertices advance horizontal, vertical, and diagonal state dimensions concurrently upon matching.
- Non-Homogeneous Transition Operators: Transition probabilities between states increment dynamically at rate 1 / (N - n) as remaining ball volume contracts.
- Absorbing Boundary Conditions: Game termination occurs when maximum coordinate value of state vector equals critical threshold, satisfying stopping condition max(ci) = target.
By computing the fundamental matrix of this absorbing Markov process, researchers derive the exact expected number of steps before absorption and the variance of time to absorption. Theoretical probability analyses published in academic repositories, including the Harvard Statistics & Combinatorics division, emphasize that multi-dimensional Markov chain modeling provides the closed-form mathematical technique capable of accounting for spatial covariance between intersecting card lines. Once the fundamental matrix is established, calculating absorption probabilities across arbitrary call intervals becomes computationally straightforward.
Probability Density Functions of Winning Call Counts
In competitive bingo tournaments, the metric of primary interest to organizers and mathematicians is the probability density function (PDF) and cumulative distribution function (CDF) of the winning call count in a room containing M independent cards. Let the random variable W represent the exact call number on which the first card in the room achieves a designated winning pattern. The probability distribution of W is heavily dependent upon participant room occupancy M. As card count M increases, probability mass shifts systematically toward earlier call numbers due to extreme value theory.
For a single 75-ball card (M = 1), line completion probability is the union of twelve paths. Median call count is approximately call 41 (mean 41.4 calls). Winning in under 15 calls on one card is under 0.0001. When M = 100 cards participate, the probability that at least one wins by call n is P(W <= n) = 1 - [1 - P(Single Card Line by n)]^M, reducing median winning call to call 19. At M = 1,000 cards, expected winning call compresses to call 14.
For 90-ball single-line bingo, probability density functions exhibit broader dispersion and higher call numbers across all room sizes. For M = 1, the median call count is call 65, whereas under M = 100 cards, the median winning call occurs around call 32 and stabilizes near call 22 for M = 1,000 cards. Baseline empirical estimates documented in our reference study on How Many Calls to Win Bingo illustrate that 90-ball games consistently require 40 to 60 percent more calls to complete than 75-ball single lines. This difference stems directly from the expanded global pool size and the total absence of a free space accelerator on European tickets.
Multi-Card Player Interference and Inter-Card Collision Statistics
A critical assumption in elementary probability analyses of bingo is that cards in a playing hall operate as statistically independent random variables. In physical reality, however, cards are drawn from a shared finite population of balls, and commercial manufacturing constraints often introduce subtle covariance structures. Furthermore, when multiple players hold cards that share common clusters of numbers, events of these cards advancing toward victory become positively correlated. This phenomenon is known as inter-card player interference or card collision.
The mathematics of card collision is closely related to the generalized birthday problem in discrete probability. If M cards are in play, what is the probability that at least two cards in the hall share at least r numbers in common across their active cells? In a 75-ball environment, where each card contains twenty-four unique numbers, expected number of shared numbers between any two randomly compiled cards is E[Shared] = 24 * (24 / 75) = approximately 7.68 numbers, with a variance of approximately 3.60.
When two cards share four numbers on the same linear trajectory, a simultaneous winning event becomes highly probable if the final missing ball is drawn. Researchers affiliated with the Oxford Probability Group demonstrate that mitigating card collision requires cryptographic shuffling algorithms that maximize Hamming distances between generated matrices. In tournament settings with M = 500 cards, the probability of a tie on the winning call in a 75-ball game reaches 12 to 18 percent, whereas six-ticket strips in 90-ball eliminate intra-player duplicates completely.
Variance Analysis in Multi-Line and Full House Scenarios
While single-line patterns are common in rapid-play gaming, full tournament sessions frequently progress through multi-tiered winning patterns: one line, two lines, and full house (blackout coverall). The transition from a single line to a full house alters statistical variance of the game fundamentally. In statistical terminology, variance measures dispersion of winning call distributions around mathematical means. A high-variance game produces unpredictable session durations, whereas low-variance games exhibit tight clustering around expected call counts.
In a 75-ball blackout, all twenty-four numbers must be marked: P(Blackout by n) = C(51, n - 24) / C(75, n) for n >= 24. For a single card, blackout on call 24 is 1 in C(75, 24) ≈ 1 in 2.47 x 10^19. Median call count on a single card is call 73. With M = 100 cards, mean winning call tightens to call 65.2 with standard deviation of 2.8 calls.
In 90-ball play, full house requires marking fifteen numbers: P(Full House by n) = C(75, n - 15) / C(90, n). For M = 100 cards, expected winning call is approximately call 64.8 with standard deviation of 3.4 calls.
- Target Cell Density Ratio: 75-ball blackout requires 24 matches out of 75 balls (32.0 percent of pool), whereas 90-ball full house requires 15 matches out of 90 balls (16.67 percent of pool).
- Distribution Compression: High room occupancies compress standard deviation by factor approximately 1 / sqrt(M), shifting probability mass into a narrow statistical window.
- Prize Escalation Thresholds: Fixed-call jackpot triggers exist in the deep extreme tail of the distribution, with probability less than 0.00005 per card.
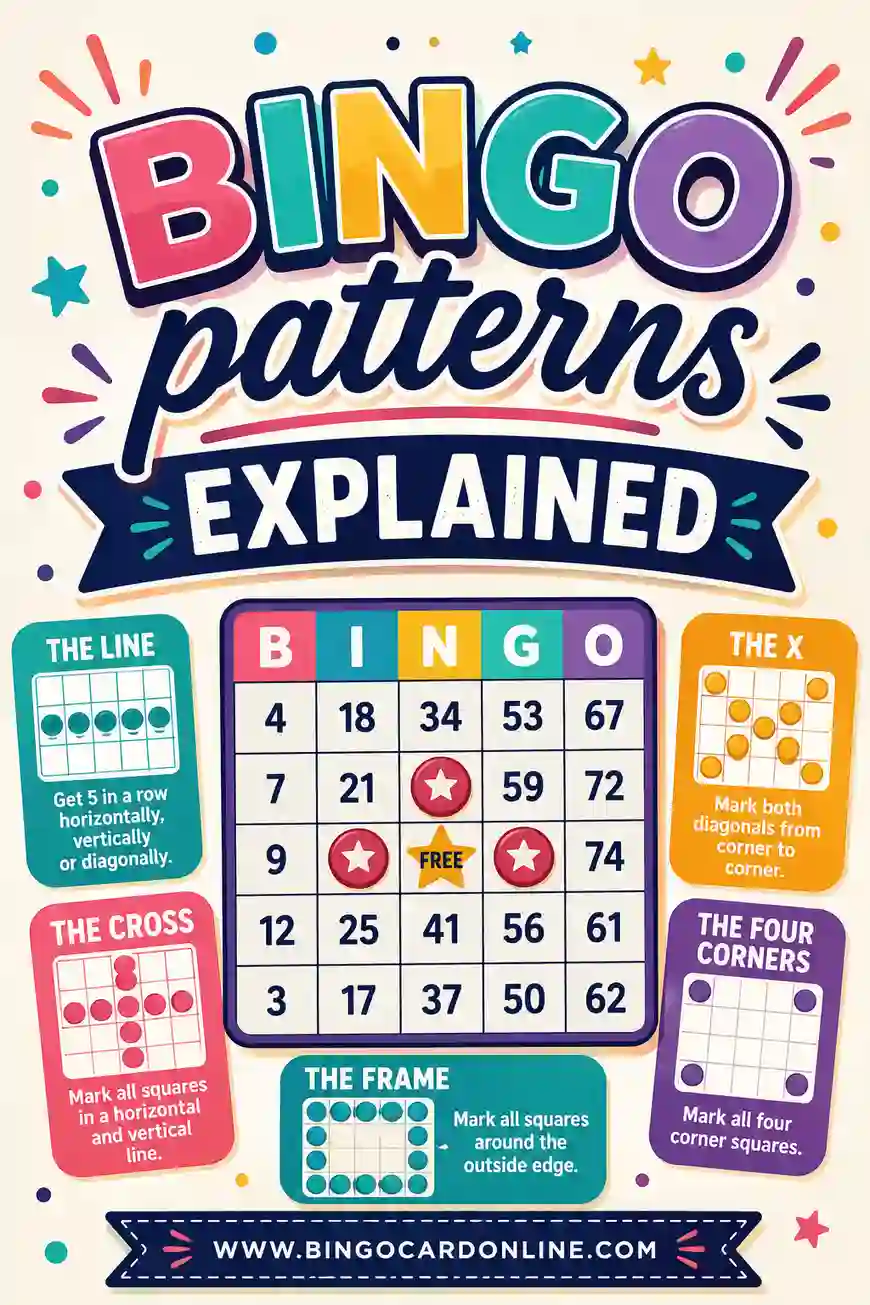
The coefficient of variation is significantly higher in 90-ball full house play than in 75-ball blackout play, making 90-ball sessions slightly more volatile in duration when room sizes fluctuate. Structural pattern dynamics detailed in our guide on Bingo Winning Patterns Explained confirm that geometric configurations dictate how rapidly winning thresholds compress under high participant volumes. Understanding these pattern mechanics allows tournament directors to balance prize distribution curves effectively.
Algorithmic Shuffling Integrity and Cryptographic Uniformity
The mathematical validity of all theoretical probability models in bingo rests upon an unyielding assumption: that selection of balls from the reservoir is perfectly uniform, independent, and identically distributed. In physical gaming halls, this is executed via mechanical pneumatic blowers that circulate ping-pong balls with calibrated mass, diameter, and surface texture. In digital online platforms, mobile applications, and printable card generators, this process is governed by algorithmic software. Implementing software-driven randomization requires rigorous adherence to cryptographic standards to prevent structural bias.
Casual bingo generators frequently err by using standard linear congruential generators that possess short periods and predictable seed cycles. To achieve mathematical fairness, software architects deploy cryptographically secure pseudo-random number generators (CSPRNG), such as ChaCha20 or AES-CTR-DRBG adhering to guidelines from the National Institute of Standards and Technology, ensuring that cycle lengths remain sufficiently large to prevent any reproducible seeds. These cryptographic standards guarantee that consecutive numbers drawn from the blower maintain zero autocorrelation.
Furthermore, when shuffling numerical arrays to populate cards or simulate caller draws, algorithms must implement the unbiased Fisher-Yates shuffle algorithm in O(n) linear time. Operational protocols established in our guide on How to Call a Bingo Game emphasize that caller cadence and draw transparency protect players against structural pattern bias. Ensuring algorithmic integrity is vital for digital platforms where cryptographic fairness preserves the mathematical integrity of every printable matrix.
Computational Simulation Methodologies for High-Occupancy Games
While closed-form mathematical equations provide exact probabilities for single cards and isolated lines, analyzing complex scenarios involving hundreds of players, overlapping multi-card patterns, and progressive tiebreaker rules rapidly exceeds analytical capacity of classical combinatorics. When multi-dimensional covariance between cards becomes analytically intractable, mathematicians deploy Monte Carlo computational simulations to model gaming ecosystems with high statistical precision.
A Monte Carlo simulation models the entire lifecycle of a bingo tournament through algorithmic iteration. The simulator establishes a virtual hall containing M structured cards generated according to precise decade or column constraints. A virtual blower shuffles the ball pool using a CSPRNG and extracts numbers sequentially. At each call, simulation updates internal state vectors of all M cards concurrently, checking for winning pattern completion. By repeating this automated simulation across 100,000 or 1,000,000 independent game iterations, researchers generate empirical probability distributions that converge asymptotically toward true mathematical values pursuant to the Law of Large Numbers.
Simulation frameworks allow analysts to calculate critical operational metrics: probability of a tie as a function of player count, distribution of near-miss states, and exact expected values of progressive jackpot pools. Advanced numerical research published by the Mathematical Association of America illustrates how computational simulation bridges the divide between theoretical discrete equations and empirical operational reality of high-occupancy gaming halls. By running millions of iterations, researchers verify that empirical results converge asymptotically with closed-form mathematical equations.
Strategic Optimization and Card Selection Mathematics
Because bingo is fundamentally a game of passive marking once numbers are allocated, player strategy cannot influence the outcome of balls drawn from the cage. However, mathematical researchers have historically investigated whether strategic selection of playing cards prior to game commencement can optimize a player's probability of victory relative to the field. Two prominent statistical theories have emerged in gaming literature: Tippett's Theory of Bingo and Granville's Randomness Balance Principles.
British statistician L.H.C. Tippett proposed that in a 75-ball game, the median is 38. As draws progress, sample means converge toward 38 per the Central Limit Theorem. Tippett hypothesized that for short single-line games, cards with boundary numbers (1-15 and 61-75) offer slight advantages, whereas extended blackout games favor numbers clustered near the median 38.
American financial analyst Joseph Granville proposed an alternative card selection heuristic based on uniform distributional balance. Granville asserted that a mathematically balanced card should feature an equal ratio of odd and even numbers, a balanced ratio of high (38-75) and low (1-37) numbers, and a uniform distribution of terminal digits (ending in 0, 1, 2, through 9). While Granville's principles ensure that a card mirrors macroscopic properties of total ball reservoirs, rigorous probability analysis proves that in an honest, uniformly shuffled game, every individual valid card possesses an identical mathematical probability of completing a designated pattern. Strategic selection does not alter a card's independent winning odds; however, holding cards with complementary numbers can minimize variance across an entire portfolio of cards played by a single participant.
Pedagogical and Cognitive Applications of Probability Grids
Beyond commercial recreation and theoretical gaming research, mathematical structures of 75-ball and 90-ball grids serve as powerful pedagogical instruments in secondary and higher education mathematics instruction. Probability grids transform abstract combinatorial formulas into tangible, visual, and participatory exercises that illuminate foundational statistical principles for students.
In undergraduate discrete mathematics curricula, educators utilize 75-ball matrix architecture to teach combinatorial constraints, permutations with and without repetition, and sample space partitioning. Asking students to derive the total number of unique cards under column segregation rules illustrates why structured constraints produce smaller, more uniform state spaces than unrestricted two-dimensional random grids. Furthermore, simulating bingo games in computer science laboratories offers practical exercises in algorithmic complexity, array shuffling efficiency, and implementation of Monte Carlo numerical simulations.
In applied statistics courses, bingo serves as an intuitive real-world baseline for exploring hypergeometric distributions, conditional probability, and Markov chain absorbing states. Educational resources including our Number Bingo (1-75) Caller Lists provide instructors with verified draw sequences to demonstrate how conditional probability distributions evolve dynamically as balls are drawn without replacement. By bridging theoretical mathematics with interactive gaming mechanics, educators demonstrate the pervasive utility of probability modeling in everyday analytical contexts.
Comparative Analytical Matrix: 75-Ball Versus 90-Ball Structural Dynamics
To synthesize mathematical, structural, and probabilistic differences between North American 75-ball and British/Commonwealth 90-ball grid systems, the analytical matrix below contrasts core architectural properties. This diagnostic comparison details how geometric dimensions, pool sizes, and cell densities dictate underlying discrete probability distributions and gameplay dynamics.
Each metric represents a foundational parameter in discrete probability modeling, illustrating how engineering decisions in grid layout alter path velocity, combinatorial state spaces, and session variance. Review the comprehensive comparative breakdown below:
| Core Dimension | 75-Ball Standard | 90-Ball Standard | Primary Model | Formula | Expected Impact |
|---|---|---|---|---|---|
| Global Pool Size | 75 Integers (1-75) | 90 Integers (1-90) | Discrete Finite Reservoir | N = 75 vs. N = 90 | Larger pool in 90-ball lowers draw probabilities per individual call. |
| Grid Geometry | 5x5 Square Matrix | 9x3 Rectangular Strip | 2D Coordinate Topology | 25 Cells vs. 27 Cells | 75-ball supports multi-directional paths; 90-ball strictly horizontal. |
| Active Target Cells | 24 Numbered + 1 Free | 15 Numbered + 12 Blank | Target Cell Density | 24/25 (96%) vs. 15/27 (56%) | 90-ball features lower physical cell density, requiring decade balancing. |
| Card Permutations | 5.524 x 10^26 Cards | Multi-Partition Strips | Column-Restricted Product | P(15,5)^4 * P(15,4) | Guarantees cryptographic uniqueness and zero collision across halls. |
| Winning Vectors | 12 Winning Vectors | 3 Horizontal Rows | Path Vector Orientation | 5 Rows + 5 Cols + 2 Diag | 75-ball exhibits multi-line covariance; 90-ball lines are parallel. |
| Center Space Role | Free Space at (3,3) | No Free Space | State Acceleration | Threshold K=4 for 4 Lines | Accelerates central and diagonal path completion by factor of 3x to 7x. |
| Median Call (M=1) | Call 41 | Call 65 | Hypergeometric CDF | CDF[P(X >= Target)] >= 0.50 | 75-ball single-line games conclude significantly faster than 90-ball lines. |
| Blackout Fraction | 24 of 75 (32.0%) | 15 of 90 (16.7%) | Target Coverage | C(51,n-24) vs. C(75,n-15) | 90-ball full house finishes earlier relative to pool due to lower target. |
| Strip Integration | Individual Cards | 6-Ticket Full Strips | Exhaustive Partitioning | 6 * 15 = Exactly 90 Numbers | Guarantees every called number marks a cell somewhere on player strip. |
This comparative diagnostic matrix underscores structural divergence between the two formats. While 75-ball bingo maximizes spatial versatility through multi-directional vectors and central acceleration, 90-ball bingo emphasizes decade balance, exhaustive strip coverage, and lower game-to-game variance across horizontal tiers. These mathematical foundations dictate session timing, tournament structure, and software architecture across all gaming applications.
Frequently Asked Questions About Bingo Probability Modeling
How does the central free space alter mathematical odds on a 75-ball card?
The pre-marked central position on a five-by-five grid provides players with an immediate head start on four specific vectors: the third horizontal tier, the third vertical column, and both diagonal paths. Because these four configurations require only four drawn numbers instead of five to complete, their cumulative completion probability advances at a much faster rate. During the opening fifteen calls of a game, an intersecting vector is statistically far more likely to produce a win than any non-intersecting line, explaining the frequent concentration of early victories along diagonal and middle rows.
Why is the hypergeometric distribution used instead of the binomial distribution?
Standard binomial calculations rely on independent events where the probability of success remains constant across trials, an assumption that only holds when items are replaced after selection. In bingo operations, drawn balls are permanently set aside on the master tracking board. Every extraction reduces the denominator of remaining uncalled numbers and shifts the relative concentration of remaining values. The hypergeometric distribution accurately calculates these non-replacement dynamics, providing exact cumulative probabilities for finite populations.
What is the mathematical probability of two players getting identical cards?
Given the rigorous column boundaries of standard five-by-five cards, the mathematical universe of possible numerical arrangements exceeds 5.524 x 10^26 ordered cards. Even when disregarding vertical row positions within each column, the unique combination count remains greater than 1.11 x 10^17. When software generators utilize high-entropy cryptographic algorithms to compile printable matrices, the chance of two participants receiving matching card layouts in the same session is astronomically tiny, effectively preventing identical-card disputes.
How does player room occupancy influence the winning call number?
Tournament attendance directly governs the velocity of game completion through extreme value mechanics. In an isolated single-card scenario, the median requirement to complete a single line on a 75-ball card hovers around the forty-first call. However, as the hall fills with one hundred competing cards, the statistical likelihood that at least one board holds an optimal distribution increases, pulling the median winning call down to approximately nineteen. In massive fields containing one thousand cards, winning claims routinely occur around the fourteenth ball.
What is the difference in game length between 75-ball and 90-ball single-line bingo?
Single-line completion in the 90-ball format takes considerably longer than in 75-ball play when comparing identical room sizes. A solitary 90-ball ticket typically requires sixty-five calls to finish a line, compared to forty-one calls on a 75-ball card. Across a tournament room with one hundred cards, 90-ball lines conclude around call thirty-two, whereas 75-ball games finish around call nineteen. This disparity arises because 90-ball tickets draw from fifteen additional numbers in the global pool and contain no central free square to shorten the required matches.
What is an integrated six-ticket strip in 90-ball bingo?
Commercial 90-ball sheets are engineered in six-card layouts where each card contains fifteen numbers, aggregating to ninety numbers in total. Every integer between 1 and 90 appears exactly once across the unified strip with zero gaps and zero duplicates. Consequently, each valid number announced by the caller marks a coordinate somewhere on the participant's layout, maintaining steady player attention and preventing long stretches without a match.
Can player strategy improve mathematical odds of winning bingo?
Because ball selection is purely stochastic and card daubing is mechanical, no gameplay strategy can alter which balls emerge from the mixing chamber. Historical frameworks like Tippett's boundary theory or Granville's symmetry principles suggest selecting cards that reflect broader statistical distributions. Nevertheless, in an honest draw governed by uniform randomization, every individual card possesses the exact same mathematical probability of achieving a pattern. The only reliable approach to increasing aggregate winning odds is acquiring a larger fraction of total cards in play.
How do software generators ensure fair and unbiased number distribution?
Professional gaming platforms deploy cryptographically secure pseudo-random number generators paired with the linear Fisher-Yates array shuffling procedure. Standard language utilities like basic random functions rely on simple linear equations that can generate cyclical patterns and slight distributional clustering over long runs. Cryptographic engines produce uniform entropy across all card coordinates, ensuring that every numerical combination has an equal opportunity of selection without mechanical or software bias.
Why does a 75-ball blackout take longer than a 90-ball full house relative to pool size?
A 75-ball blackout demands covering twenty-four numbers out of seventy-five, which constitutes 32 percent of the global pool. In contrast, a 90-ball full house requires covering fifteen numbers out of ninety, representing just 16.67 percent of total available balls. Because a 90-ball participant must capture roughly half the relative proportion of the reservoir compared to a 75-ball player, full house games wrap up earlier relative to total pool cardinality, producing distinct variance profiles between the two tournament traditions.
Strategic Roadmap for Mathematical Verification and Fair Game Design
The comparative mathematical modeling of 75-ball and 90-ball bingo grids demonstrates that visual layout choices directly govern underlying probability distributions, game velocity, and player engagement dynamics. Far from being interchangeable variations of a simple drawing mechanic, the 5x5 square matrix and 9x3 decade strip represent two distinct mathematical philosophies. The 75-ball matrix prioritizes multi-vector geometric versatility, spatial intersection complexity, and accelerated path velocity via central free spaces. The 90-ball strip format emphasizes decade stratification, complete strip integration, and stable horizontal progression with zero coordinate bias.
For educational instructors, game theorists, and software architects designing digital gaming platforms, understanding these combinatorial and probabilistic mechanics is essential. System designers must account for hypergeometric sampling realities, avoiding the analytical trap of applying binomial approximations to closed finite pools. Furthermore, digital generators must implement cryptographically validated shuffling algorithms, such as Fisher-Yates implementations powered by high-entropy CSPRNG sources, ensuring astronomical combinatorial potentials are realized with uncompromising fairness and uniformity.
As modern gaming continues to evolve across digital and physical mediums, mathematical probability modeling remains the definitive standard for evaluating game integrity, session duration forecasting, and fair tournament architecture. By anchoring game design in rigorous discrete mathematics, organizers guarantee an equitable, transparent, and intellectually sound experience for all participants. By establishing auditable statistical checkpoints, tournament directors and platform engineers ensure continuous adherence to theoretical expectations, eliminating perceptual biases while maintaining complete player trust. Ultimately, rigorous probability modeling bridges theoretical combinatorial principles with practical operational integrity, ensuring that both physical hall tournaments and modern web platforms operate on unassailable mathematical footings across every session.